- Bitcoin miners recently sold over $83 million in BTC.
- BTC dropped to the $67,000 level.
bitcoin [BTC] has seen declines in recent days, with the most significant decline occurring on June 11. In response to this decline, miners have been selling off their holdings to take some profits.
However, these sales are not reflected on the stock exchanges. Despite these circumstances, open interest continues to maintain a respectable volume.
OTC sales deplete the bitcoin miner’s reserve
An analysis of Bitcoin miners’ key metrics revealed a decline in miners’ holdings. The stock of miners saw slight declines while maintaining a volume of around 1.8 million.
However, tracking miner outflows has shown a decrease, indicating that the volume sent to exchanges from miners’ wallets has decreased.
The metrics can be confusing at first because the flow of BTC from miners’ wallets is not visible, yet the reserve has seen declines.
However, the situation becomes clearer when analyzing over-the-counter (OTC) sales.
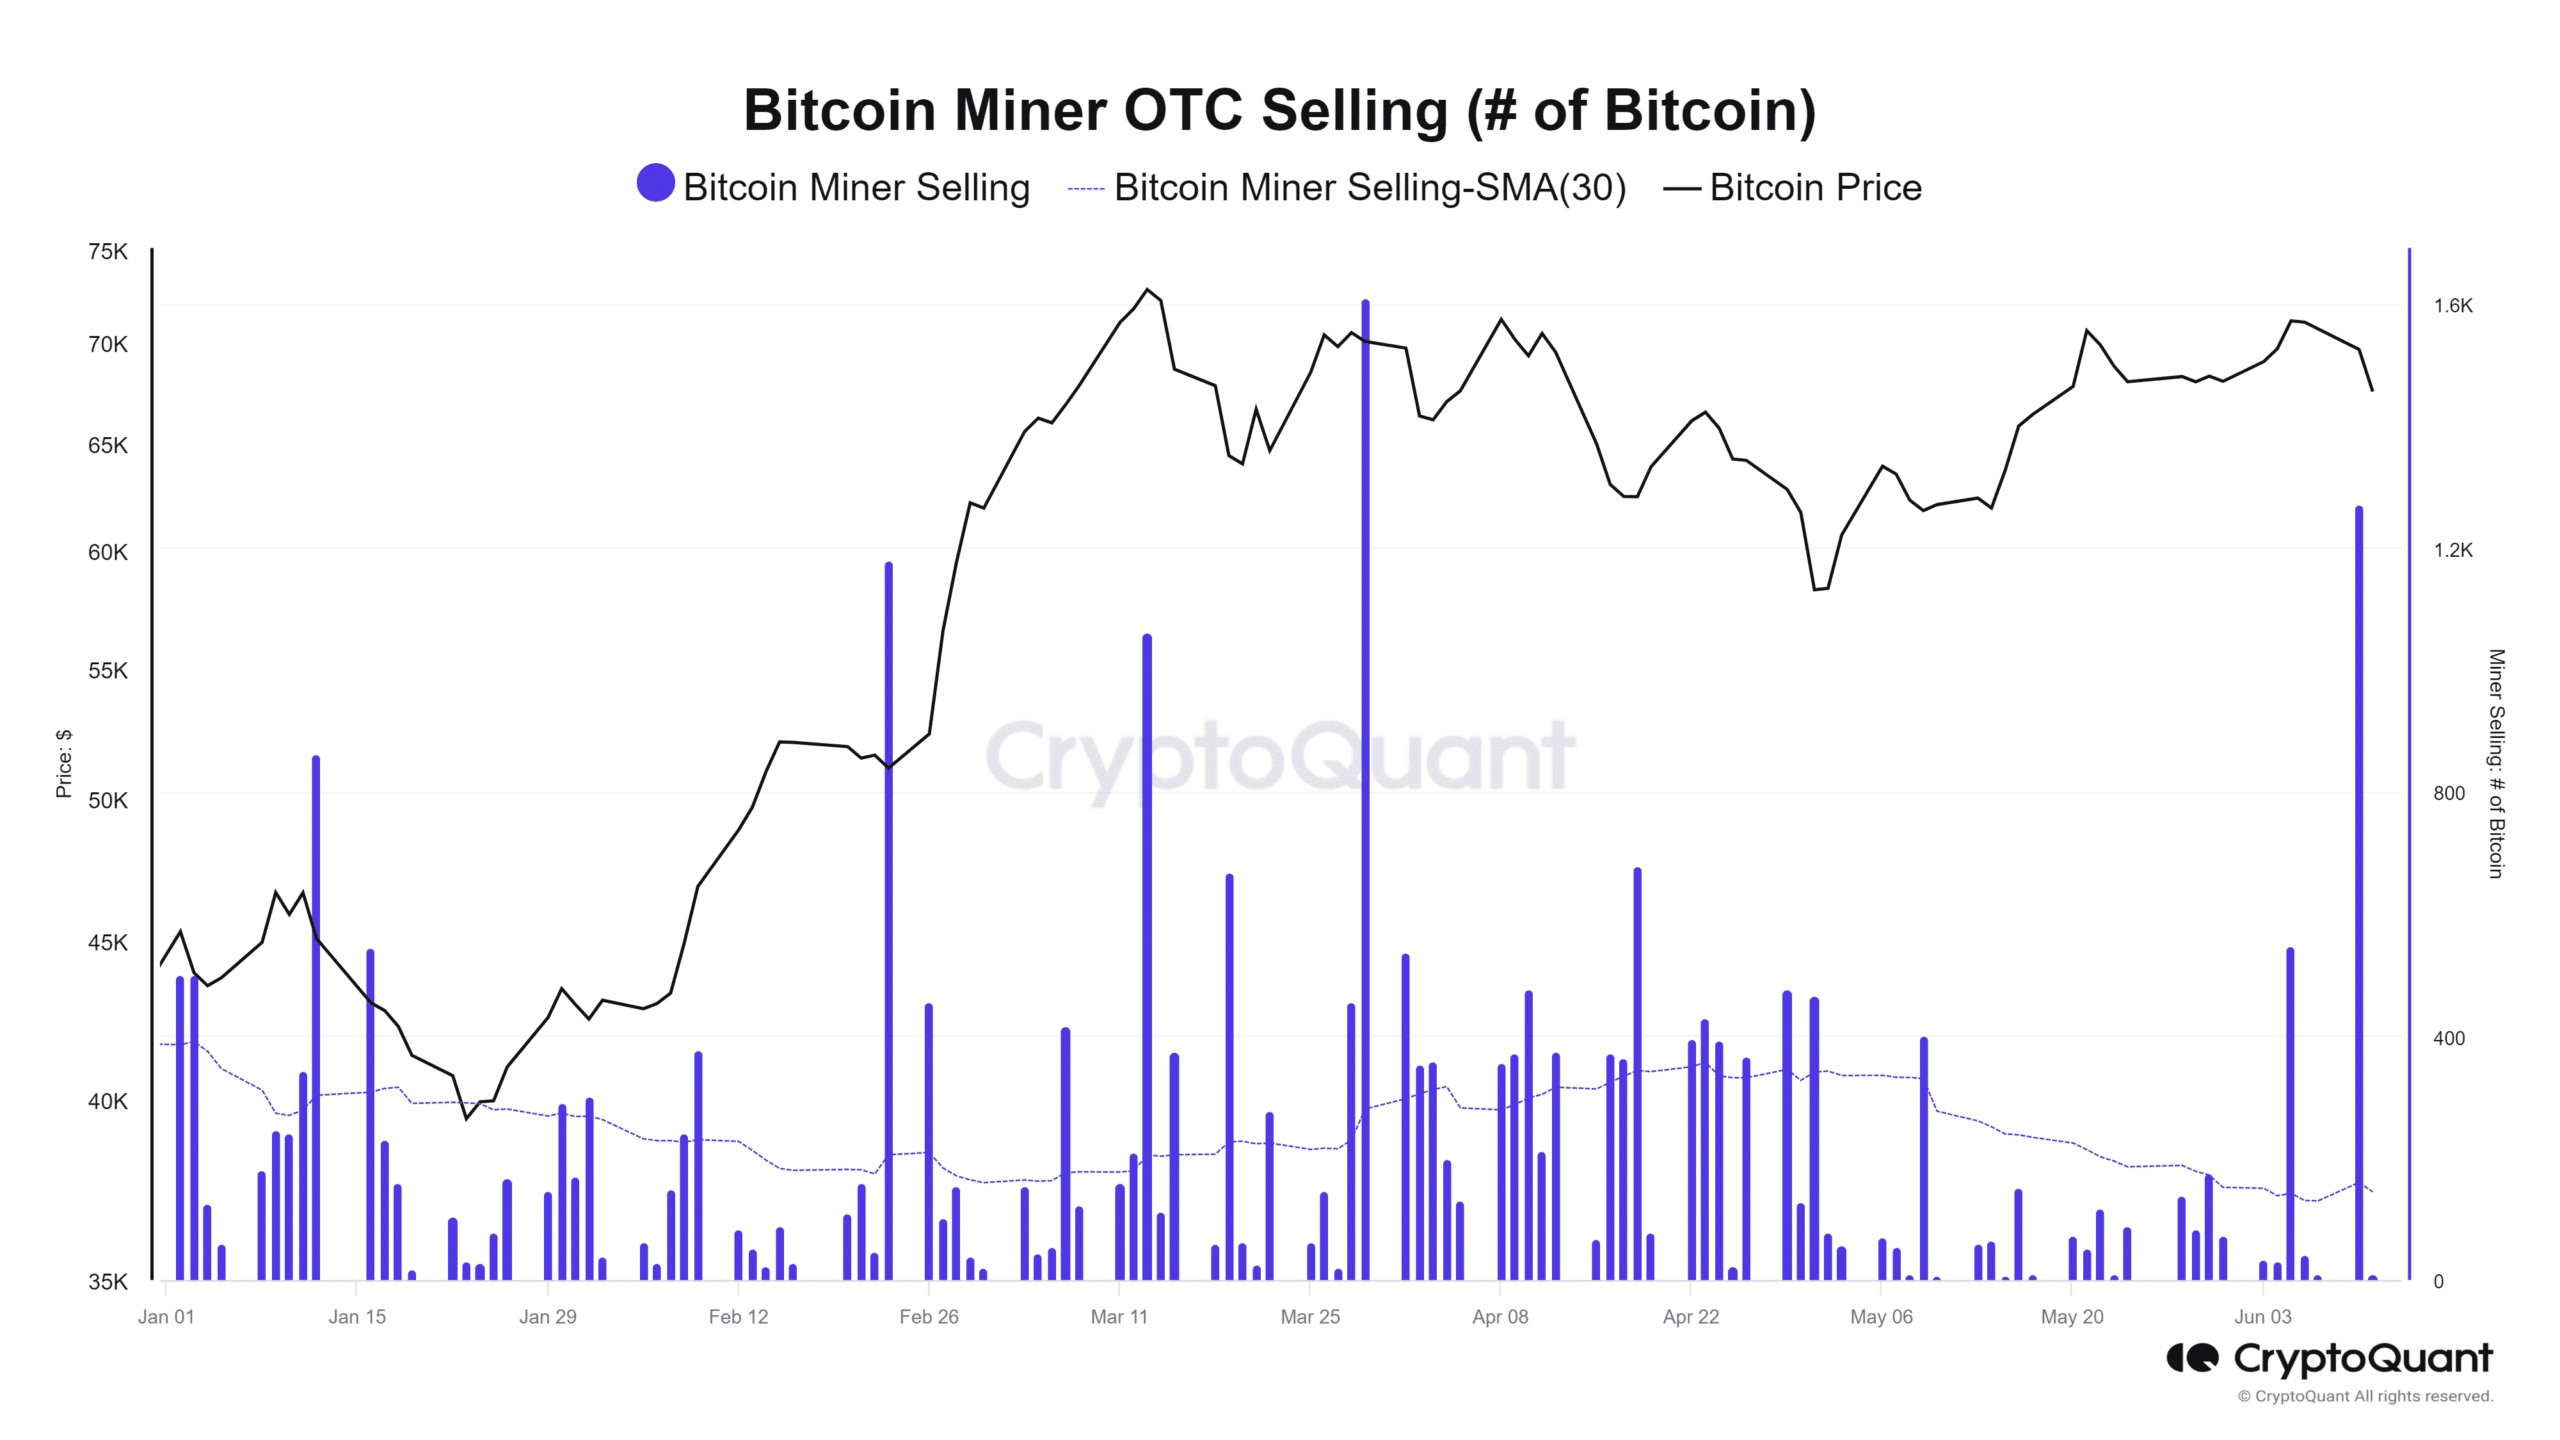
Source: CryptoQuant
BTC Miner’s analysis of OTC sales has revealed that some major mining companies are selling their stakes. According to a chart on CryptoQuant, there was recently the largest OTC selloff since late March, with around 1,200 BTC sold.
This is a sign of miner capitulation, suggesting that miners are selling their BTC holdings, potentially due to financial pressures or to lock in profits amid a market downturn.
These types of transactions do not have an immediate impact on exchange volumes, but still reduce the overall reserve.
How BTC performed during the sell-off
Bitcoin analysis on the daily time frame chart has shown a negative trend for the past seven days. AMBCrypto’s price trend analysis showed that between June 6 and 7, the price of Bitcoin fell from the $70,000 range to around $68,000.
However, BTC experienced another big drop on June 11, lowering its price. Chart analysis showed that it fell more than 3%, bringing its price down to the $67,000 mark.
At this rate, Bitcoin was moving dangerously close to its short-term moving average (yellow line), which served as support in the price range around $65,000.

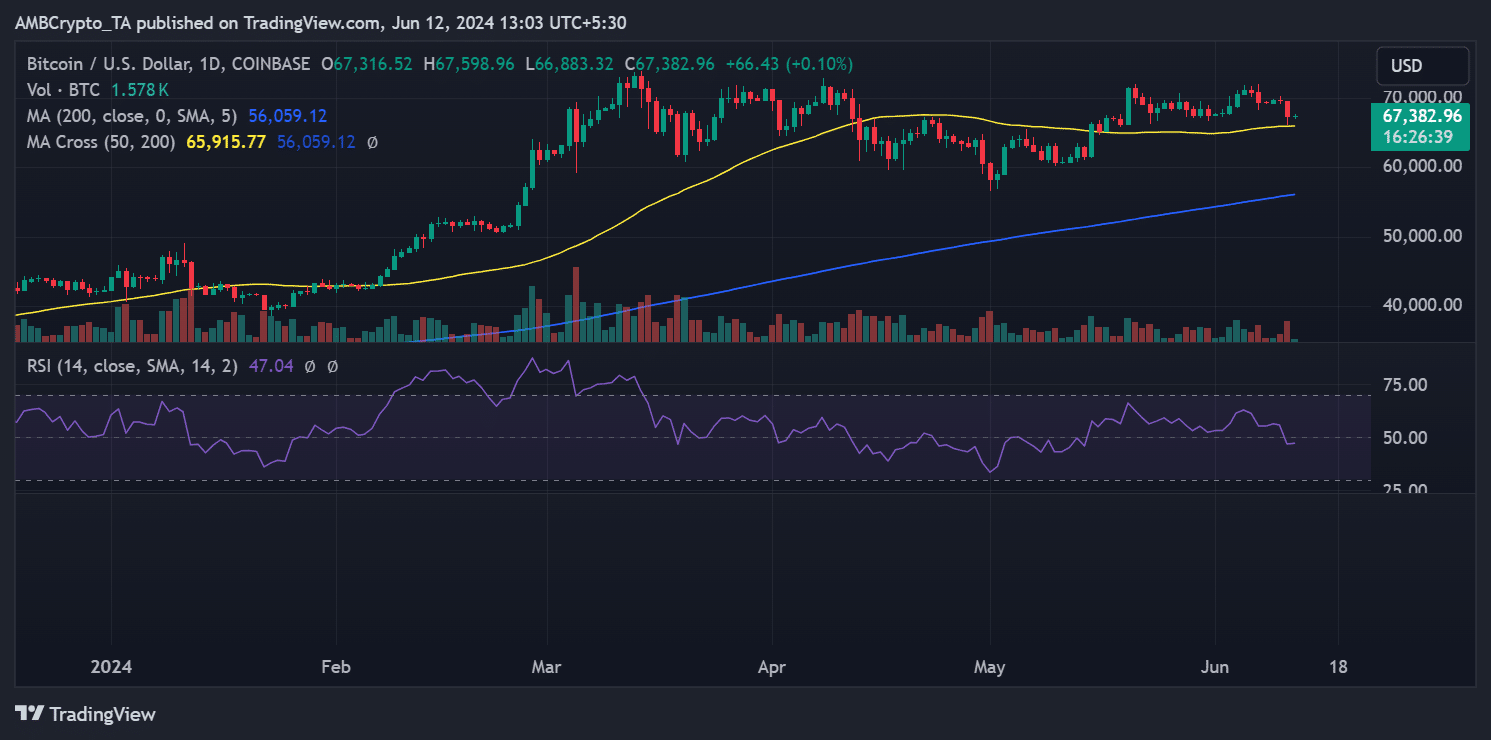
Source: TradingView
At the time of writing, BTC is trading at around $67,400 with a slight attempt at an uptrend.
An analysis of its Relative Strength Index (RSI) showed that it is now below the neutral line, with an RSI around 47. This indicates that BTC is currently in a bearish trend.
Bitcoin is still enjoying a lot of interest
An analysis of another key metric revealed that despite the miner sell-off and price decline, there is still a lot of interest in Bitcoin.
This suggests that even in the event of a bearish trend, there remains significant engagement and potential optimism in the market.
A look at the Open Interest chart from Coinglass showed it was around $34 billion at the time of writing.
Analysis of the chart showed that its all-time high (ATH) was around $39 billion, the level reached in March when the price of BTC exceeded $70,000.
This suggests that the cash flow has not stopped and many traders are buying due to the decline in price.

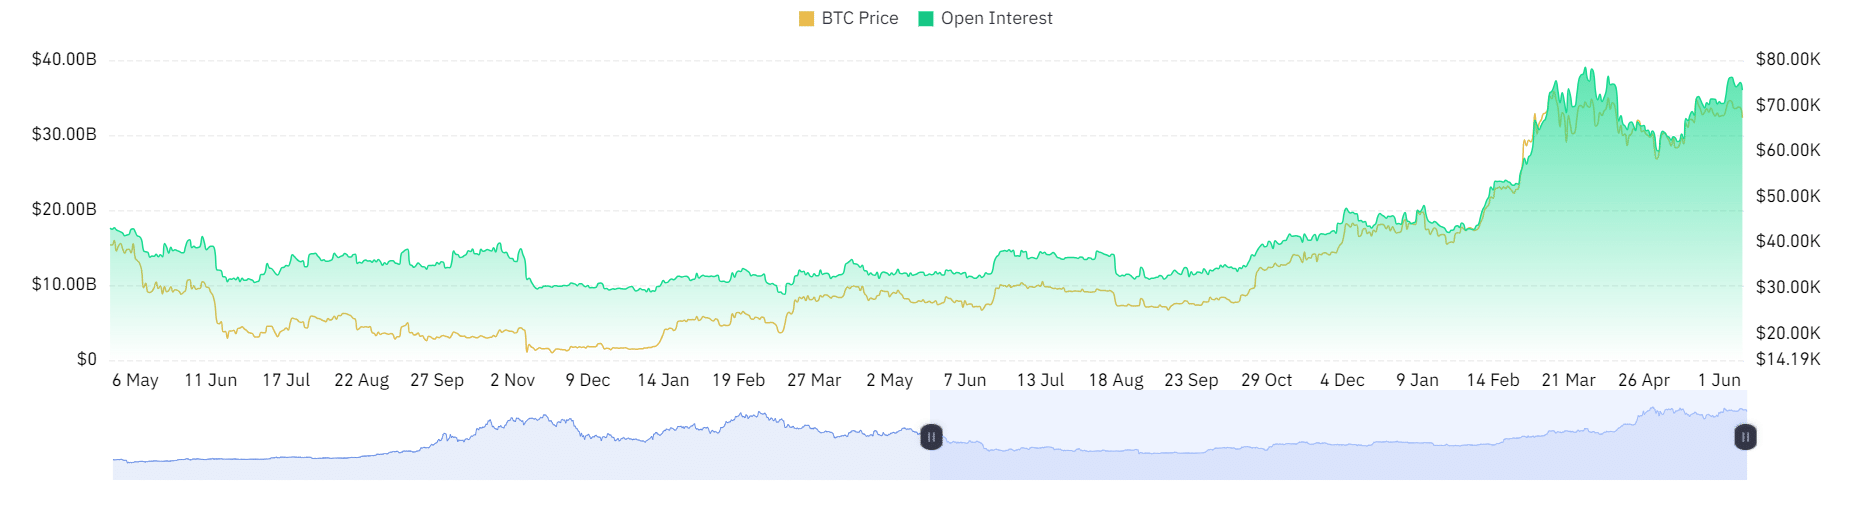
Source: Coinglass
Read Bitcoin (BTC) Price Prediction 2024-2025
Furthermore, a comparison of the current open interest (OI) with its all-time high (ATH) shows that there has been no significant loss of positive sentiment around the BTC price.
Despite recent declines, traders remain engaged and optimistic about Bitcoin’s potential.